Data presentation: A comprehensive guide
Learn how to create data presentation effectively and communicate your insights in a way that is clear, concise, and engaging.
Raja Bothra
Building presentations


Table of contents
Hey there, fellow data enthusiast!
Welcome to our comprehensive guide on data presentation.
Whether you're an experienced presenter or just starting, this guide will help you present your data like a pro. We'll dive deep into what data presentation is, why it's crucial, and how to master it. So, let's embark on this data-driven journey together.
What is data presentation?
Data presentation is the art of transforming raw data into a visual format that's easy to understand and interpret. It's like turning numbers and statistics into a captivating story that your audience can quickly grasp. When done right, data presentation can be a game-changer, enabling you to convey complex information effectively.
Why are data presentations important?
Imagine drowning in a sea of numbers and figures. That's how your audience might feel without proper data presentation. Here's why it's essential:
- Clarity : Data presentations make complex information clear and concise.
- Engagement : Visuals, such as charts and graphs, grab your audience's attention.
- Comprehension : Visual data is easier to understand than long, numerical reports.
- Decision-making : Well-presented data aids informed decision-making.
- Impact : It leaves a lasting impression on your audience.
Types of data presentation:
Now, let's delve into the diverse array of data presentation methods, each with its own unique strengths and applications. We have three primary types of data presentation, and within these categories, numerous specific visualization techniques can be employed to effectively convey your data.
1. Textual presentation
Textual presentation harnesses the power of words and sentences to elucidate and contextualize your data. This method is commonly used to provide a narrative framework for the data, offering explanations, insights, and the broader implications of your findings. It serves as a foundation for a deeper understanding of the data's significance.
2. Tabular presentation
Tabular presentation employs tables to arrange and structure your data systematically. These tables are invaluable for comparing various data groups or illustrating how data evolves over time. They present information in a neat and organized format, facilitating straightforward comparisons and reference points.
3. Graphical presentation
Graphical presentation harnesses the visual impact of charts and graphs to breathe life into your data. Charts and graphs are powerful tools for spotlighting trends, patterns, and relationships hidden within the data. Let's explore some common graphical presentation methods:
- Bar charts: They are ideal for comparing different categories of data. In this method, each category is represented by a distinct bar, and the height of the bar corresponds to the value it represents. Bar charts provide a clear and intuitive way to discern differences between categories.
- Pie charts: It excel at illustrating the relative proportions of different data categories. Each category is depicted as a slice of the pie, with the size of each slice corresponding to the percentage of the total value it represents. Pie charts are particularly effective for showcasing the distribution of data.
- Line graphs: They are the go-to choice when showcasing how data evolves over time. Each point on the line represents a specific value at a particular time period. This method enables viewers to track trends and fluctuations effortlessly, making it perfect for visualizing data with temporal dimensions.
- Scatter plots: They are the tool of choice when exploring the relationship between two variables. In this method, each point on the plot represents a pair of values for the two variables in question. Scatter plots help identify correlations, outliers, and patterns within data pairs.
The selection of the most suitable data presentation method hinges on the specific dataset and the presentation's objectives. For instance, when comparing sales figures of different products, a bar chart shines in its simplicity and clarity. On the other hand, if your aim is to display how a product's sales have changed over time, a line graph provides the ideal visual narrative.
Additionally, it's crucial to factor in your audience's level of familiarity with data presentations. For a technical audience, more intricate visualization methods may be appropriate. However, when presenting to a general audience, opting for straightforward and easily understandable visuals is often the wisest choice.
In the world of data presentation, choosing the right method is akin to selecting the perfect brush for a masterpiece. Each tool has its place, and understanding when and how to use them is key to crafting compelling and insightful presentations. So, consider your data carefully, align your purpose, and paint a vivid picture that resonates with your audience.
What to include in data presentation?
When creating your data presentation, remember these key components:
- Data points : Clearly state the data points you're presenting.
- Comparison : Highlight comparisons and trends in your data.
- Graphical methods : Choose the right chart or graph for your data.
- Infographics : Use visuals like infographics to make information more digestible.
- Numerical values : Include numerical values to support your visuals.
- Qualitative information : Explain the significance of the data.
- Source citation : Always cite your data sources.
How to structure an effective data presentation?
Creating a well-structured data presentation is not just important; it's the backbone of a successful presentation. Here's a step-by-step guide to help you craft a compelling and organized presentation that captivates your audience:
1. Know your audience
Understanding your audience is paramount. Consider their needs, interests, and existing knowledge about your topic. Tailor your presentation to their level of understanding, ensuring that it resonates with them on a personal level. Relevance is the key.
2. Have a clear message
Every effective data presentation should convey a clear and concise message. Determine what you want your audience to learn or take away from your presentation, and make sure your message is the guiding light throughout your presentation. Ensure that all your data points align with and support this central message.
3. Tell a compelling story
Human beings are naturally wired to remember stories. Incorporate storytelling techniques into your presentation to make your data more relatable and memorable. Your data can be the backbone of a captivating narrative, whether it's about a trend, a problem, or a solution. Take your audience on a journey through your data.
4. Leverage visuals
Visuals are a powerful tool in data presentation. They make complex information accessible and engaging. Utilize charts, graphs, and images to illustrate your points and enhance the visual appeal of your presentation. Visuals should not just be an accessory; they should be an integral part of your storytelling.
5. Be clear and concise
Avoid jargon or technical language that your audience may not comprehend. Use plain language and explain your data points clearly. Remember, clarity is king. Each piece of information should be easy for your audience to digest.
6. Practice your delivery
Practice makes perfect. Rehearse your presentation multiple times before the actual delivery. This will help you deliver it smoothly and confidently, reducing the chances of stumbling over your words or losing track of your message.
A basic structure for an effective data presentation
Armed with a comprehensive comprehension of how to construct a compelling data presentation, you can now utilize this fundamental template for guidance:
In the introduction, initiate your presentation by introducing both yourself and the topic at hand. Clearly articulate your main message or the fundamental concept you intend to communicate.
Moving on to the body of your presentation, organize your data in a coherent and easily understandable sequence. Employ visuals generously to elucidate your points and weave a narrative that enhances the overall story. Ensure that the arrangement of your data aligns with and reinforces your central message.
As you approach the conclusion, succinctly recapitulate your key points and emphasize your core message once more. Conclude by leaving your audience with a distinct and memorable takeaway, ensuring that your presentation has a lasting impact.
Additional tips for enhancing your data presentation
To take your data presentation to the next level, consider these additional tips:
- Consistent design : Maintain a uniform design throughout your presentation. This not only enhances visual appeal but also aids in seamless comprehension.
- High-quality visuals : Ensure that your visuals are of high quality, easy to read, and directly relevant to your topic.
- Concise text : Avoid overwhelming your slides with excessive text. Focus on the most critical points, using visuals to support and elaborate.
- Anticipate questions : Think ahead about the questions your audience might pose. Be prepared with well-thought-out answers to foster productive discussions.
By following these guidelines, you can structure an effective data presentation that not only informs but also engages and inspires your audience. Remember, a well-structured presentation is the bridge that connects your data to your audience's understanding and appreciation.
Do’s and don'ts on a data presentation
- Use visuals : Incorporate charts and graphs to enhance understanding.
- Keep it simple : Avoid clutter and complexity.
- Highlight key points : Emphasize crucial data.
- Engage the audience : Encourage questions and discussions.
- Practice : Rehearse your presentation.
Don'ts:
- Overload with data : Less is often more; don't overwhelm your audience.
- Fit Unrelated data : Stay on topic; don't include irrelevant information.
- Neglect the audience : Ensure your presentation suits your audience's level of expertise.
- Read word-for-word : Avoid reading directly from slides.
- Lose focus : Stick to your presentation's purpose.
Summarizing key takeaways
- Definition : Data presentation is the art of visualizing complex data for better understanding.
- Importance : Data presentations enhance clarity, engage the audience, aid decision-making, and leave a lasting impact.
- Types : Textual, Tabular, and Graphical presentations offer various ways to present data.
- Choosing methods : Select the right method based on data, audience, and purpose.
- Components : Include data points, comparisons, visuals, infographics, numerical values, and source citations.
- Structure : Know your audience, have a clear message, tell a compelling story, use visuals, be concise, and practice.
- Do's and don'ts : Do use visuals, keep it simple, highlight key points, engage the audience, and practice. Don't overload with data, include unrelated information, neglect the audience's expertise, read word-for-word, or lose focus.
FAQ's on a data presentation
1. what is data presentation, and why is it important in 2024.
Data presentation is the process of visually representing data sets to convey information effectively to an audience. In an era where the amount of data generated is vast, visually presenting data using methods such as diagrams, graphs, and charts has become crucial. By simplifying complex data sets, presentation of the data may helps your audience quickly grasp much information without drowning in a sea of chart's, analytics, facts and figures.
2. What are some common methods of data presentation?
There are various methods of data presentation, including graphs and charts, histograms, and cumulative frequency polygons. Each method has its strengths and is often used depending on the type of data you're using and the message you want to convey. For instance, if you want to show data over time, try using a line graph. If you're presenting geographical data, consider to use a heat map.
3. How can I ensure that my data presentation is clear and readable?
To ensure that your data presentation is clear and readable, pay attention to the design and labeling of your charts. Don't forget to label the axes appropriately, as they are critical for understanding the values they represent. Don't fit all the information in one slide or in a single paragraph. Presentation software like Prezent and PowerPoint can help you simplify your vertical axis, charts and tables, making them much easier to understand.
4. What are some common mistakes presenters make when presenting data?
One common mistake is trying to fit too much data into a single chart, which can distort the information and confuse the audience. Another mistake is not considering the needs of the audience. Remember that your audience won't have the same level of familiarity with the data as you do, so it's essential to present the data effectively and respond to questions during a Q&A session.
5. How can I use data visualization to present important data effectively on platforms like LinkedIn?
When presenting data on platforms like LinkedIn, consider using eye-catching visuals like bar graphs or charts. Use concise captions and e.g., examples to highlight the single most important information in your data report. Visuals, such as graphs and tables, can help you stand out in the sea of textual content, making your data presentation more engaging and shareable among your LinkedIn connections.
Create your data presentation with prezent
Prezent can be a valuable tool for creating data presentations. Here's how Prezent can help you in this regard:
- Time savings : Prezent saves up to 70% of presentation creation time, allowing you to focus on data analysis and insights.
- On-brand consistency : Ensure 100% brand alignment with Prezent's brand-approved designs for professional-looking data presentations.
- Effortless collaboration : Real-time sharing and collaboration features make it easy for teams to work together on data presentations.
- Data storytelling : Choose from 50+ storylines to effectively communicate data insights and engage your audience.
- Personalization : Create tailored data presentations that resonate with your audience's preferences, enhancing the impact of your data.
In summary, Prezent streamlines the process of creating data presentations by offering time-saving features, ensuring brand consistency, promoting collaboration, and providing tools for effective data storytelling. Whether you need to present data to clients, stakeholders, or within your organization, Prezent can significantly enhance your presentation-making process.
So, go ahead, present your data with confidence, and watch your audience be wowed by your expertise.
Thank you for joining us on this data-driven journey. Stay tuned for more insights, and remember, data presentation is your ticket to making numbers come alive! Sign up for our free trial or book a demo !
More zenpedia articles

Top AI tools for HR teams: Solutions for professionals

15 must-have AI tools for product managers

Must-have tips to deliver a stunning presentation in just 5 minutes
Get the latest from Prezent community
Join thousands of subscribers who receive our best practices on communication, storytelling, presentation design, and more. New tips weekly. (No spam, we promise!)
- Interactive Presentation
10 Methods of Data Presentation That Really Work in 2024
Leah Nguyen • 20 August, 2024 • 13 min read
Have you ever presented a data report to your boss/coworkers/teachers thinking it was super dope like you’re some cyber hacker living in the Matrix, but all they saw was a pile of static numbers that seemed pointless and didn't make sense to them?
Understanding digits is rigid . Making people from non-analytical backgrounds understand those digits is even more challenging.
How can you clear up those confusing numbers and make your presentation as clear as the day? Let's check out these best ways to present data. 💎
More Tips with AhaSlides
- Marketing Presentation
- Survey Result Presentation
- Types of Presentation

Start in seconds.
Get any of the above examples as templates. Sign up for free and take what you want from the template library!
Data Presentation - What Is It?
The term ’data presentation’ relates to the way you present data in a way that makes even the most clueless person in the room understand.
Some say it’s witchcraft (you’re manipulating the numbers in some ways), but we’ll just say it’s the power of turning dry, hard numbers or digits into a visual showcase that is easy for people to digest.
Presenting data correctly can help your audience understand complicated processes, identify trends, and instantly pinpoint whatever is going on without exhausting their brains.
Good data presentation helps…
- Make informed decisions and arrive at positive outcomes . If you see the sales of your product steadily increase throughout the years, it’s best to keep milking it or start turning it into a bunch of spin-offs (shoutout to Star Wars👀).
- Reduce the time spent processing data . Humans can digest information graphically 60,000 times faster than in the form of text. Grant them the power of skimming through a decade of data in minutes with some extra spicy graphs and charts.
- Communicate the results clearly . Data does not lie. They’re based on factual evidence and therefore if anyone keeps whining that you might be wrong, slap them with some hard data to keep their mouths shut.
- Add to or expand the current research . You can see what areas need improvement, as well as what details often go unnoticed while surfing through those little lines, dots or icons that appear on the data board.
Methods of Data Presentation and Examples
Imagine you have a delicious pepperoni, extra-cheese pizza. You can decide to cut it into the classic 8 triangle slices, the party style 12 square slices, or get creative and abstract on those slices.
There are various ways to cut a pizza and you get the same variety with how you present your data. In this section, we will bring you the 10 ways to slice a pizza - we mean to present your data - that will make your company’s most important asset as clear as day. Let's dive into 10 ways to present data efficiently.
#1 - Tabular
Among various types of data presentation, tabular is the most fundamental method, with data presented in rows and columns. Excel or Google Sheets would qualify for the job. Nothing fancy.
This is an example of a tabular presentation of data on Google Sheets. Each row and column has an attribute (year, region, revenue, etc.), and you can do a custom format to see the change in revenue throughout the year.
When presenting data as text, all you do is write your findings down in paragraphs and bullet points, and that’s it. A piece of cake to you, a tough nut to crack for whoever has to go through all of the reading to get to the point.
- 65% of email users worldwide access their email via a mobile device.
- Emails that are optimised for mobile generate 15% higher click-through rates.
- 56% of brands using emojis in their email subject lines had a higher open rate.
(Source: CustomerThermometer )
All the above quotes present statistical information in textual form. Since not many people like going through a wall of texts, you’ll have to figure out another route when deciding to use this method, such as breaking the data down into short, clear statements, or even as catchy puns if you’ve got the time to think of them.
#3 - Pie chart
A pie chart (or a ‘donut chart’ if you stick a hole in the middle of it) is a circle divided into slices that show the relative sizes of data within a whole. If you’re using it to show percentages, make sure all the slices add up to 100%.
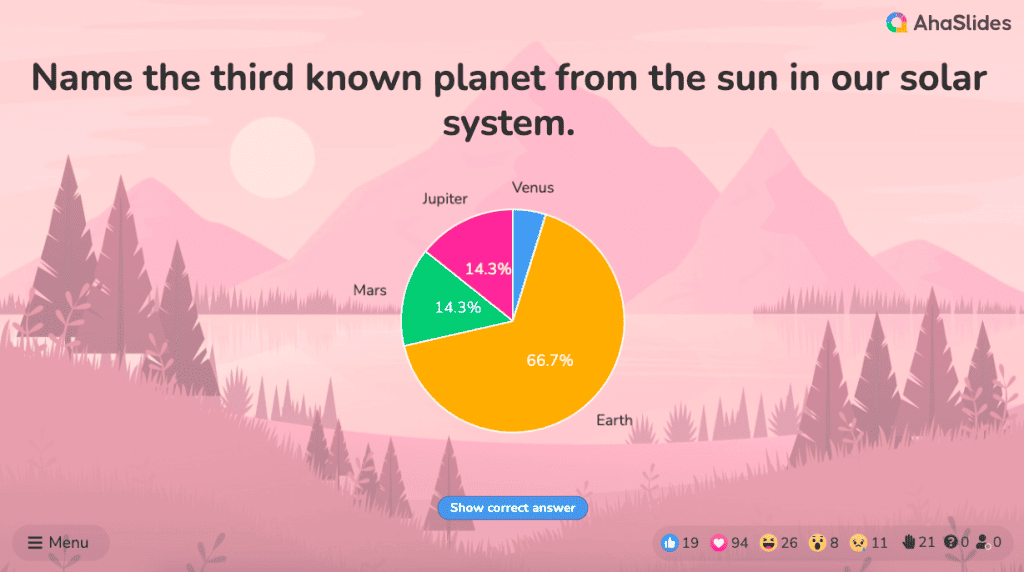
The pie chart is a familiar face at every party and is usually recognised by most people. However, one setback of using this method is our eyes sometimes can’t identify the differences in slices of a circle, and it’s nearly impossible to compare similar slices from two different pie charts, making them the villains in the eyes of data analysts.
#4 - Bar chart
The bar chart is a chart that presents a bunch of items from the same category, usually in the form of rectangular bars that are placed at an equal distance from each other. Their heights or lengths depict the values they represent.
They can be as simple as this:
Or more complex and detailed like this example of data presentation. Contributing to an effective statistic presentation, this one is a grouped bar chart that not only allows you to compare categories but also the groups within them as well.
#5 - Histogram
Similar in appearance to the bar chart but the rectangular bars in histograms don’t often have the gap like their counterparts.
Instead of measuring categories like weather preferences or favourite films as a bar chart does, a histogram only measures things that can be put into numbers.
Teachers can use presentation graphs like a histogram to see which score group most of the students fall into, like in this example above.
#6 - Line graph
Recordings to ways of displaying data, we shouldn't overlook the effectiveness of line graphs. Line graphs are represented by a group of data points joined together by a straight line. There can be one or more lines to compare how several related things change over time.
On a line chart’s horizontal axis, you usually have text labels, dates or years, while the vertical axis usually represents the quantity (e.g.: budget, temperature or percentage).
#7 - Pictogram graph
A pictogram graph uses pictures or icons relating to the main topic to visualise a small dataset. The fun combination of colours and illustrations makes it a frequent use at schools.
Pictograms are a breath of fresh air if you want to stay away from the monotonous line chart or bar chart for a while. However, they can present a very limited amount of data and sometimes they are only there for displays and do not represent real statistics.
#8 - Radar chart
If presenting five or more variables in the form of a bar chart is too stuffy then you should try using a radar chart, which is one of the most creative ways to present data.
Radar charts show data in terms of how they compare to each other starting from the same point. Some also call them ‘spider charts’ because each aspect combined looks like a spider web.
Radar charts can be a great use for parents who’d like to compare their child’s grades with their peers to lower their self-esteem. You can see that each angular represents a subject with a score value ranging from 0 to 100. Each student’s score across 5 subjects is highlighted in a different colour.
If you think that this method of data presentation somehow feels familiar, then you’ve probably encountered one while playing Pokémon .
#9 - Heat map
A heat map represents data density in colours. The bigger the number, the more colour intensity that data will be represented.
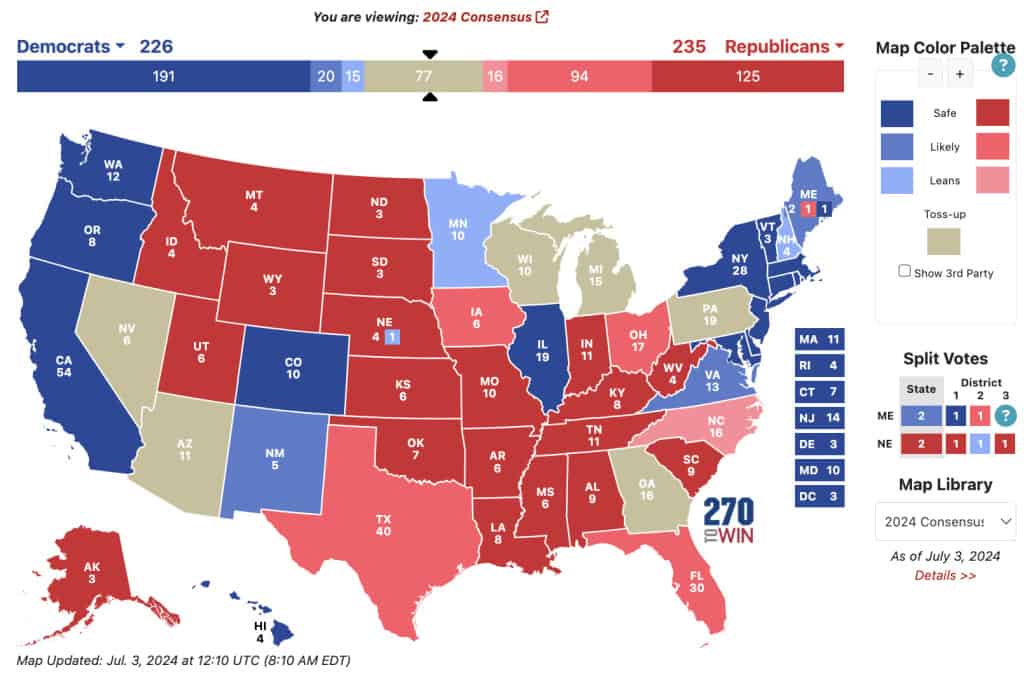
Most US citizens would be familiar with this data presentation method in geography. For elections, many news outlets assign a specific colour code to a state, with blue representing one candidate and red representing the other. The shade of either blue or red in each state shows the strength of the overall vote in that state.
Another great thing you can use a heat map for is to map what visitors to your site click on. The more a particular section is clicked the ‘hotter’ the colour will turn, from blue to bright yellow to red.

#10 - Scatter plot
If you present your data in dots instead of chunky bars, you’ll have a scatter plot.
A scatter plot is a grid with several inputs showing the relationship between two variables. It’s good at collecting seemingly random data and revealing some telling trends.
For example, in this graph, each dot shows the average daily temperature versus the number of beach visitors across several days. You can see that the dots get higher as the temperature increases, so it’s likely that hotter weather leads to more visitors.
5 Data Presentation Mistakes to Avoid
#1 - assume your audience understands what the numbers represent.
You may know all the behind-the-scenes of your data since you’ve worked with them for weeks, but your audience doesn’t.
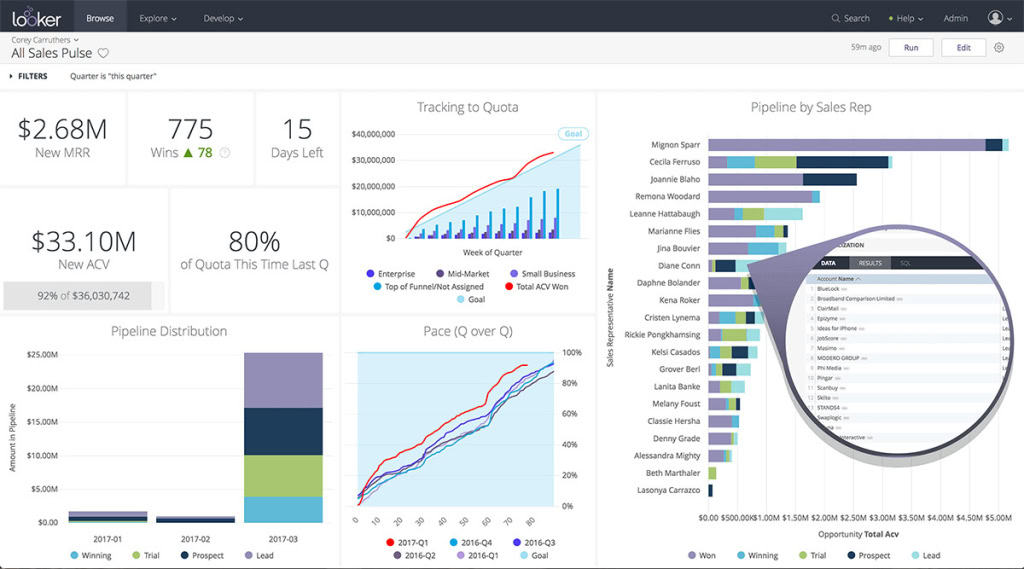
Showing without telling only invites more and more questions from your audience, as they have to constantly make sense of your data, wasting the time of both sides as a result.
While showing your data presentations, you should tell them what the data are about before hitting them with waves of numbers first. You can use interactive activities such as polls , word clouds , online quizzes and Q&A sections , combined with icebreaker games , to assess their understanding of the data and address any confusion beforehand.
#2 - Use the wrong type of chart
Charts such as pie charts must have a total of 100% so if your numbers accumulate to 193% like this example below, you’re definitely doing it wrong.
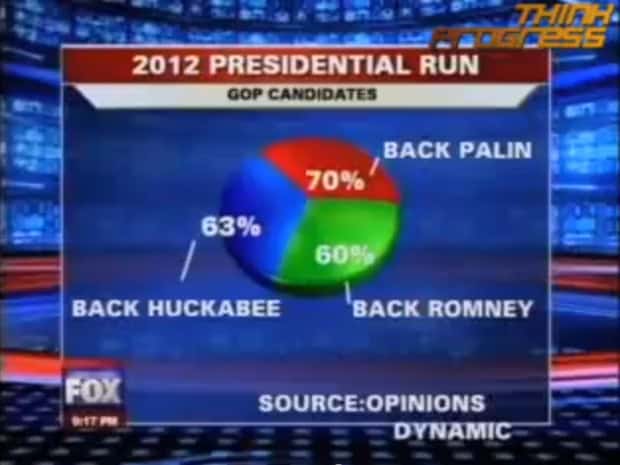
Before making a chart, ask yourself: what do I want to accomplish with my data? Do you want to see the relationship between the data sets, show the up and down trends of your data, or see how segments of one thing make up a whole?
Remember, clarity always comes first. Some data visualisations may look cool, but if they don’t fit your data, steer clear of them.
#3 - Make it 3D
3D is a fascinating graphical presentation example. The third dimension is cool, but full of risks.
Can you see what’s behind those red bars? Because we can’t either. You may think that 3D charts add more depth to the design, but they can create false perceptions as our eyes see 3D objects closer and bigger than they appear, not to mention they cannot be seen from multiple angles.
#4 - Use different types of charts to compare contents in the same category
This is like comparing a fish to a monkey. Your audience won’t be able to identify the differences and make an appropriate correlation between the two data sets.
Next time, stick to one type of data presentation only. Avoid the temptation of trying various data visualisation methods in one go and make your data as accessible as possible.
#5 - Bombard the audience with too much information
The goal of data presentation is to make complex topics much easier to understand, and if you’re bringing too much information to the table, you’re missing the point.
The more information you give, the more time it will take for your audience to process it all. If you want to make your data understandable and give your audience a chance to remember it, keep the information within it to an absolute minimum. You should end your session with open-ended questions to see what your participants really think.
What are the Best Methods of Data Presentation?
Finally, which is the best way to present data?
The answer is…
There is none! Each type of presentation has its own strengths and weaknesses and the one you choose greatly depends on what you’re trying to do.
For example:
- Go for a scatter plot if you’re exploring the relationship between different data values, like seeing whether the sales of ice cream go up because of the temperature or because people are just getting more hungry and greedy each day?
- Go for a line graph if you want to mark a trend over time.
- Go for a heat map if you like some fancy visualisation of the changes in a geographical location, or to see your visitors' behaviour on your website.
- Go for a pie chart (especially in 3D) if you want to be shunned by others because it was never a good idea👇
Frequently Asked Questions
What is a chart presentation.
A chart presentation is a way of presenting data or information using visual aids such as charts, graphs, and diagrams. The purpose of a chart presentation is to make complex information more accessible and understandable for the audience.
When can I use charts for the presentation?
Charts can be used to compare data, show trends over time, highlight patterns, and simplify complex information.
Why should you use charts for presentation?
You should use charts to ensure your contents and visuals look clean, as they are the visual representative, provide clarity, simplicity, comparison, contrast and super time-saving!
What are the 4 graphical methods of presenting data?
Histogram, Smoothed frequency graph, Pie diagram or Pie chart, Cumulative or ogive frequency graph, and Frequency Polygon.

Leah Nguyen
Words that convert, stories that stick. I turn complex ideas into engaging narratives - helping audiences learn, remember, and take action.
Tips to Engage with Polls & Trivia
More from AhaSlides

We use essential cookies to make Venngage work. By clicking “Accept All Cookies”, you agree to the storing of cookies on your device to enhance site navigation, analyze site usage, and assist in our marketing efforts.
Manage Cookies
Cookies and similar technologies collect certain information about how you’re using our website. Some of them are essential, and without them you wouldn’t be able to use Venngage. But others are optional, and you get to choose whether we use them or not.
Strictly Necessary Cookies
These cookies are always on, as they’re essential for making Venngage work, and making it safe. Without these cookies, services you’ve asked for can’t be provided.
Show cookie providers
- Google Login
Functionality Cookies
These cookies help us provide enhanced functionality and personalisation, and remember your settings. They may be set by us or by third party providers.
Performance Cookies
These cookies help us analyze how many people are using Venngage, where they come from and how they're using it. If you opt out of these cookies, we can’t get feedback to make Venngage better for you and all our users.
- Google Analytics
Targeting Cookies
These cookies are set by our advertising partners to track your activity and show you relevant Venngage ads on other sites as you browse the internet.
- Google Tag Manager
- Infographics
- Daily Infographics
- Popular Templates
- Accessibility
- Graphic Design
- Graphs and Charts
- Data Visualization
- Human Resources
- Beginner Guides
Blog Data Visualization 10 Data Presentation Examples For Strategic Communication
10 Data Presentation Examples For Strategic Communication
Written by: Krystle Wong Sep 28, 2023
Knowing how to present data is like having a superpower.
Data presentation today is no longer just about numbers on a screen; it’s storytelling with a purpose. It’s about captivating your audience, making complex stuff look simple and inspiring action.
To help turn your data into stories that stick, influence decisions and make an impact, check out Venngage’s free chart maker or follow me on a tour into the world of data storytelling along with data presentation templates that work across different fields, from business boardrooms to the classroom and beyond. Keep scrolling to learn more!
Click to jump ahead:
10 Essential data presentation examples + methods you should know
What should be included in a data presentation, what are some common mistakes to avoid when presenting data, faqs on data presentation examples, transform your message with impactful data storytelling.
Data presentation is a vital skill in today’s information-driven world. Whether you’re in business, academia, or simply want to convey information effectively, knowing the different ways of presenting data is crucial. For impactful data storytelling, consider these essential data presentation methods:
1. Bar graph
Ideal for comparing data across categories or showing trends over time.
Bar graphs, also known as bar charts are workhorses of data presentation. They’re like the Swiss Army knives of visualization methods because they can be used to compare data in different categories or display data changes over time.
In a bar chart, categories are displayed on the x-axis and the corresponding values are represented by the height of the bars on the y-axis.
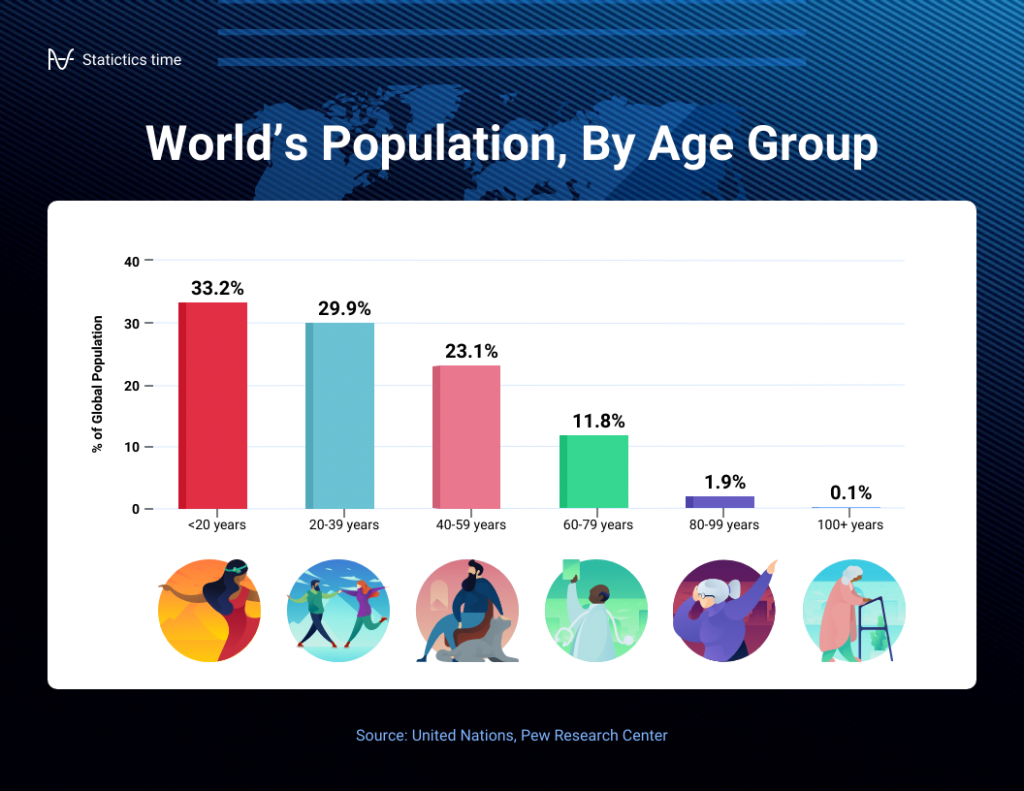
It’s a straightforward and effective way to showcase raw data, making it a staple in business reports, academic presentations and beyond.
Make sure your bar charts are concise with easy-to-read labels. Whether your bars go up or sideways, keep it simple by not overloading with too many categories.

2. Line graph
Great for displaying trends and variations in data points over time or continuous variables.
Line charts or line graphs are your go-to when you want to visualize trends and variations in data sets over time.
One of the best quantitative data presentation examples, they work exceptionally well for showing continuous data, such as sales projections over the last couple of years or supply and demand fluctuations.
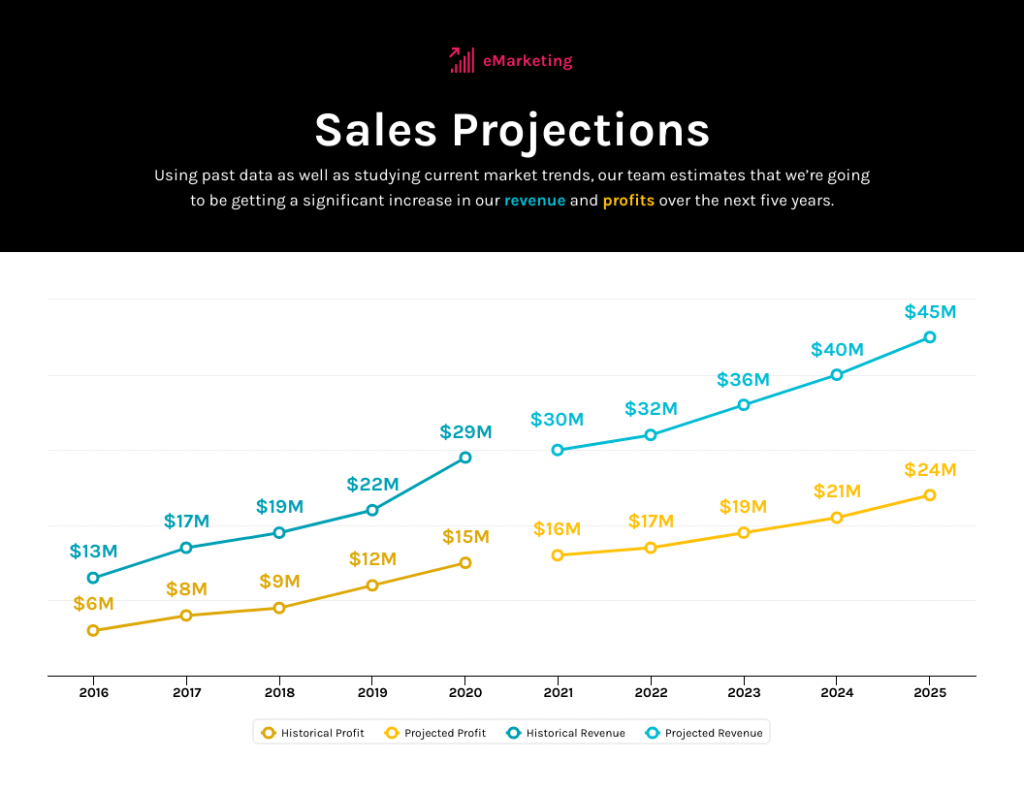
The x-axis represents time or a continuous variable and the y-axis represents the data values. By connecting the data points with lines, you can easily spot trends and fluctuations.
A tip when presenting data with line charts is to minimize the lines and not make it too crowded. Highlight the big changes, put on some labels and give it a catchy title.

3. Pie chart
Useful for illustrating parts of a whole, such as percentages or proportions.
Pie charts are perfect for showing how a whole is divided into parts. They’re commonly used to represent percentages or proportions and are great for presenting survey results that involve demographic data.
Each “slice” of the pie represents a portion of the whole and the size of each slice corresponds to its share of the total.

While pie charts are handy for illustrating simple distributions, they can become confusing when dealing with too many categories or when the differences in proportions are subtle.
Don’t get too carried away with slices — label those slices with percentages or values so people know what’s what and consider using a legend for more categories.

4. Scatter plot
Effective for showing the relationship between two variables and identifying correlations.
Scatter plots are all about exploring relationships between two variables. They’re great for uncovering correlations, trends or patterns in data.
In a scatter plot, every data point appears as a dot on the chart, with one variable marked on the horizontal x-axis and the other on the vertical y-axis.

By examining the scatter of points from heat map software , you can discern the nature of the relationship between the variables, whether it’s positive, negative or no correlation at all.
If you’re using scatter plots to reveal relationships between two variables, be sure to add trendlines or regression analysis when appropriate to clarify patterns. Label data points selectively or provide tooltips for detailed information.

5. Histogram
Best for visualizing the distribution and frequency of a single variable.
Histograms are your choice when you want to understand the distribution and frequency of a single variable.
They divide the data into “bins” or intervals and the height of each bar represents the frequency or count of data points falling into that interval.

Histograms are excellent for helping to identify trends in data distributions, such as peaks, gaps or skewness.
Here’s something to take note of — ensure that your histogram bins are appropriately sized to capture meaningful data patterns. Using clear axis labels and titles can also help explain the distribution of the data effectively.

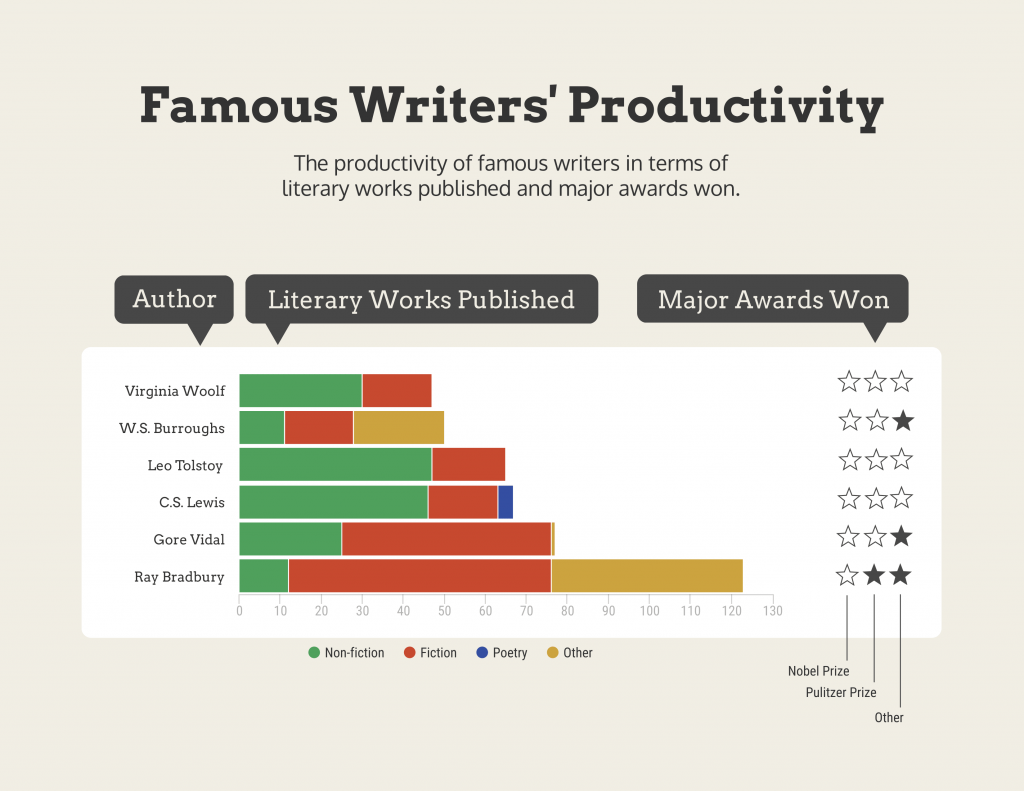
6. Stacked bar chart
Useful for showing how different components contribute to a whole over multiple categories.
Stacked bar charts are a handy choice when you want to illustrate how different components contribute to a whole across multiple categories.
Each bar represents a category and the bars are divided into segments to show the contribution of various components within each category.
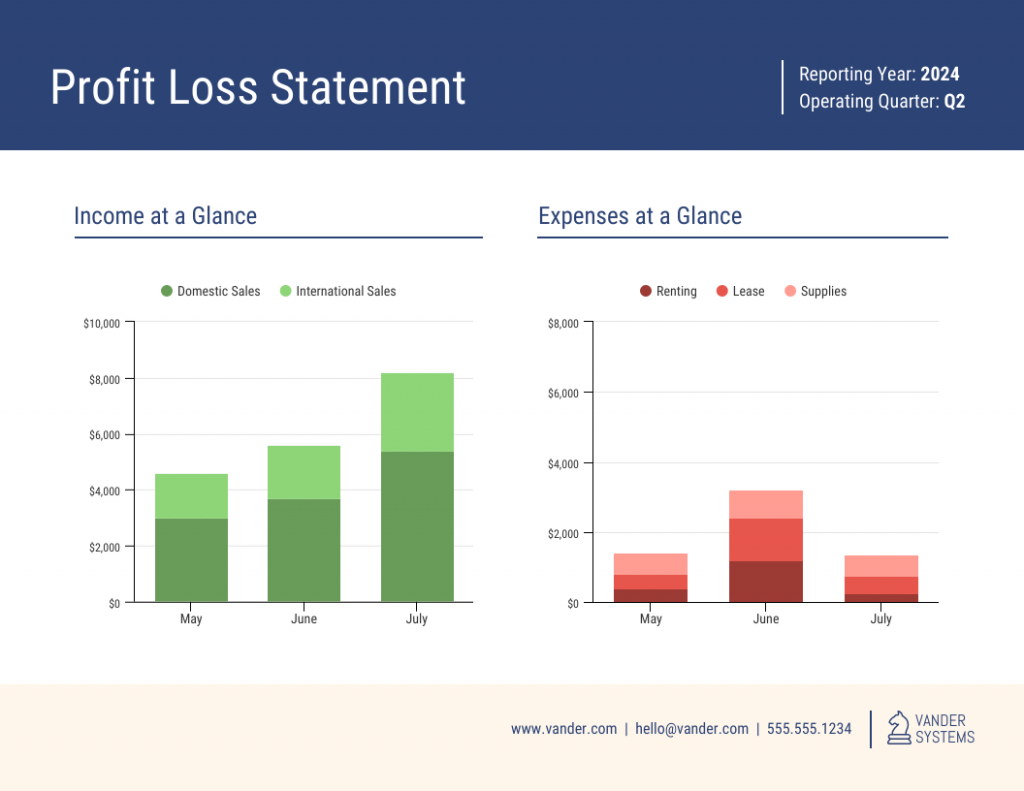
This method is ideal for highlighting both the individual and collective significance of each component, making it a valuable tool for comparative analysis.
Stacked bar charts are like data sandwiches—label each layer so people know what’s what. Keep the order logical and don’t forget the paintbrush for snazzy colors. Here’s a data analysis presentation example on writers’ productivity using stacked bar charts:
7. Area chart
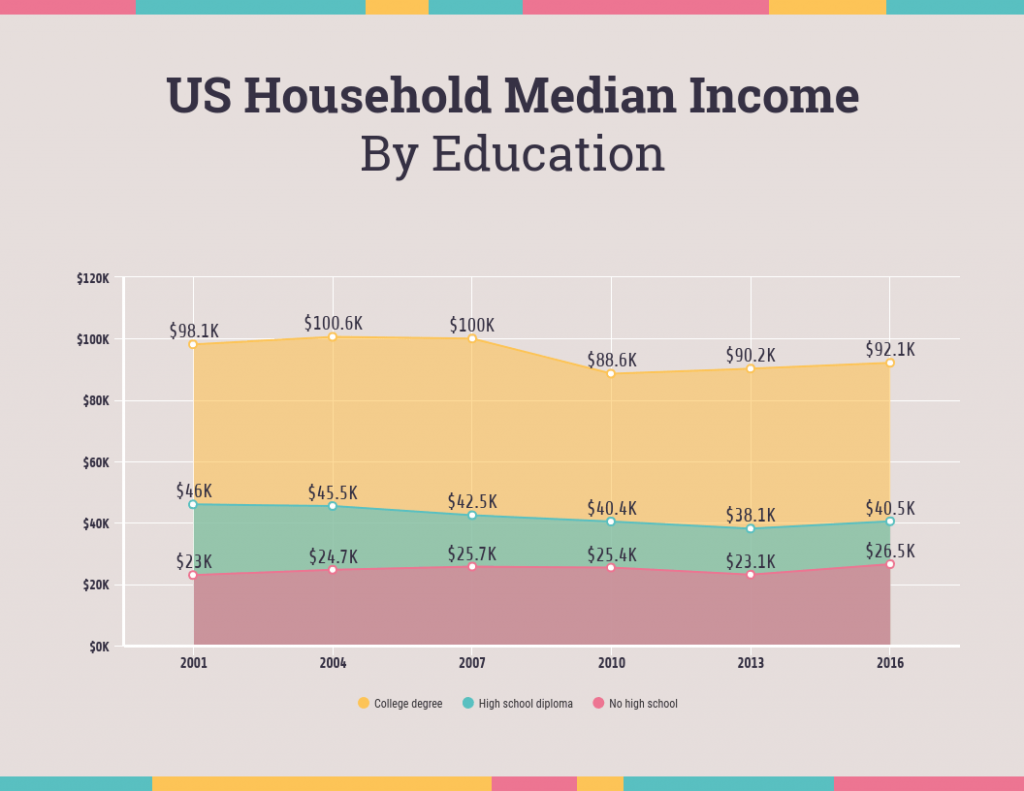
Similar to line charts but with the area below the lines filled, making them suitable for showing cumulative data.
Area charts are close cousins of line charts but come with a twist.
Imagine plotting the sales of a product over several months. In an area chart, the space between the line and the x-axis is filled, providing a visual representation of the cumulative total.

This makes it easy to see how values stack up over time, making area charts a valuable tool for tracking trends in data.
For area charts, use them to visualize cumulative data and trends, but avoid overcrowding the chart. Add labels, especially at significant points and make sure the area under the lines is filled with a visually appealing color gradient.
8. Tabular presentation
Presenting data in rows and columns, often used for precise data values and comparisons.
Tabular data presentation is all about clarity and precision. Think of it as presenting numerical data in a structured grid, with rows and columns clearly displaying individual data points.
A table is invaluable for showcasing detailed data, facilitating comparisons and presenting numerical information that needs to be exact. They’re commonly used in reports, spreadsheets and academic papers.

When presenting tabular data, organize it neatly with clear headers and appropriate column widths. Highlight important data points or patterns using shading or font formatting for better readability.
9. Textual data
Utilizing written or descriptive content to explain or complement data, such as annotations or explanatory text.
Textual data presentation may not involve charts or graphs, but it’s one of the most used qualitative data presentation examples.
It involves using written content to provide context, explanations or annotations alongside data visuals. Think of it as the narrative that guides your audience through the data.
Well-crafted textual data can make complex information more accessible and help your audience understand the significance of the numbers and visuals.
Textual data is your chance to tell a story. Break down complex information into bullet points or short paragraphs and use headings to guide the reader’s attention.
10. Pictogram
Using simple icons or images to represent data is especially useful for conveying information in a visually intuitive manner.
Pictograms are all about harnessing the power of images to convey data in an easy-to-understand way.
Instead of using numbers or complex graphs, you use simple icons or images to represent data points.
For instance, you could use a thumbs up emoji to illustrate customer satisfaction levels, where each face represents a different level of satisfaction.

Pictograms are great for conveying data visually, so choose symbols that are easy to interpret and relevant to the data. Use consistent scaling and a legend to explain the symbols’ meanings, ensuring clarity in your presentation.

Looking for more data presentation ideas? Use the Venngage graph maker or browse through our gallery of chart templates to pick a template and get started!
A comprehensive data presentation should include several key elements to effectively convey information and insights to your audience. Here’s a list of what should be included in a data presentation:
1. Title and objective
- Begin with a clear and informative title that sets the context for your presentation.
- State the primary objective or purpose of the presentation to provide a clear focus.

2. Key data points
- Present the most essential data points or findings that align with your objective.
- Use charts, graphical presentations or visuals to illustrate these key points for better comprehension.

3. Context and significance
- Provide a brief overview of the context in which the data was collected and why it’s significant.
- Explain how the data relates to the larger picture or the problem you’re addressing.
4. Key takeaways
- Summarize the main insights or conclusions that can be drawn from the data.
- Highlight the key takeaways that the audience should remember.
5. Visuals and charts
- Use clear and appropriate visual aids to complement the data.
- Ensure that visuals are easy to understand and support your narrative.

6. Implications or actions
- Discuss the practical implications of the data or any recommended actions.
- If applicable, outline next steps or decisions that should be taken based on the data.

7. Q&A and discussion
- Allocate time for questions and open discussion to engage the audience.
- Address queries and provide additional insights or context as needed.
Presenting data is a crucial skill in various professional fields, from business to academia and beyond. To ensure your data presentations hit the mark, here are some common mistakes that you should steer clear of:
Overloading with data
Presenting too much data at once can overwhelm your audience. Focus on the key points and relevant information to keep the presentation concise and focused. Here are some free data visualization tools you can use to convey data in an engaging and impactful way.
Assuming everyone’s on the same page
It’s easy to assume that your audience understands as much about the topic as you do. But this can lead to either dumbing things down too much or diving into a bunch of jargon that leaves folks scratching their heads. Take a beat to figure out where your audience is coming from and tailor your presentation accordingly.
Misleading visuals
Using misleading visuals, such as distorted scales or inappropriate chart types can distort the data’s meaning. Pick the right data infographics and understandable charts to ensure that your visual representations accurately reflect the data.
Not providing context
Data without context is like a puzzle piece with no picture on it. Without proper context, data may be meaningless or misinterpreted. Explain the background, methodology and significance of the data.
Not citing sources properly
Neglecting to cite sources and provide citations for your data can erode its credibility. Always attribute data to its source and utilize reliable sources for your presentation.
Not telling a story
Avoid simply presenting numbers. If your presentation lacks a clear, engaging story that takes your audience on a journey from the beginning (setting the scene) through the middle (data analysis) to the end (the big insights and recommendations), you’re likely to lose their interest.
Infographics are great for storytelling because they mix cool visuals with short and sweet text to explain complicated stuff in a fun and easy way. Create one with Venngage’s free infographic maker to create a memorable story that your audience will remember.
Ignoring data quality
Presenting data without first checking its quality and accuracy can lead to misinformation. Validate and clean your data before presenting it.
Simplify your visuals
Fancy charts might look cool, but if they confuse people, what’s the point? Go for the simplest visual that gets your message across. Having a dilemma between presenting data with infographics v.s data design? This article on the difference between data design and infographics might help you out.
Missing the emotional connection
Data isn’t just about numbers; it’s about people and real-life situations. Don’t forget to sprinkle in some human touch, whether it’s through relatable stories, examples or showing how the data impacts real lives.
Skipping the actionable insights
At the end of the day, your audience wants to know what they should do with all the data. If you don’t wrap up with clear, actionable insights or recommendations, you’re leaving them hanging. Always finish up with practical takeaways and the next steps.
Can you provide some data presentation examples for business reports?
Business reports often benefit from data presentation through bar charts showing sales trends over time, pie charts displaying market share,or tables presenting financial performance metrics like revenue and profit margins.
What are some creative data presentation examples for academic presentations?
Creative data presentation ideas for academic presentations include using statistical infographics to illustrate research findings and statistical data, incorporating storytelling techniques to engage the audience or utilizing heat maps to visualize data patterns.
What are the key considerations when choosing the right data presentation format?
When choosing a chart format , consider factors like data complexity, audience expertise and the message you want to convey. Options include charts (e.g., bar, line, pie), tables, heat maps, data visualization infographics and interactive dashboards.
Knowing the type of data visualization that best serves your data is just half the battle. Here are some best practices for data visualization to make sure that the final output is optimized.
How can I choose the right data presentation method for my data?
To select the right data presentation method, start by defining your presentation’s purpose and audience. Then, match your data type (e.g., quantitative, qualitative) with suitable visualization techniques (e.g., histograms, word clouds) and choose an appropriate presentation format (e.g., slide deck, report, live demo).
For more presentation ideas , check out this guide on how to make a good presentation or use a presentation software to simplify the process.
How can I make my data presentations more engaging and informative?
To enhance data presentations, use compelling narratives, relatable examples and fun data infographics that simplify complex data. Encourage audience interaction, offer actionable insights and incorporate storytelling elements to engage and inform effectively.
The opening of your presentation holds immense power in setting the stage for your audience. To design a presentation and convey your data in an engaging and informative, try out Venngage’s free presentation maker to pick the right presentation design for your audience and topic.
What is the difference between data visualization and data presentation?
Data presentation typically involves conveying data reports and insights to an audience, often using visuals like charts and graphs. Data visualization , on the other hand, focuses on creating those visual representations of data to facilitate understanding and analysis.
Now that you’ve learned a thing or two about how to use these methods of data presentation to tell a compelling data story , it’s time to take these strategies and make them your own.
But here’s the deal: these aren’t just one-size-fits-all solutions. Remember that each example we’ve uncovered here is not a rigid template but a source of inspiration. It’s all about making your audience go, “Wow, I get it now!”
Think of your data presentations as your canvas – it’s where you paint your story, convey meaningful insights and make real change happen.
So, go forth, present your data with confidence and purpose and watch as your strategic influence grows, one compelling presentation at a time.
Discover popular designs

Infographic maker

Brochure maker

White paper online

Newsletter creator

Flyer maker

Timeline maker

Letterhead maker

Mind map maker

Ebook maker

IMAGES
VIDEO